Civil Engineer Salary in Richmond, CA: $120,384 (2026)
Quick Answer:A full-time civil engineer in Richmond, CA earns a median $120,384/year (≈ $57.87/hour) in nominal terms for 2026 — projected from BLS OEWS 2025 (SOC 17-2051). Once you factor in Richmond's price level (13% above national, BEA RPP 113.1), that paycheck buys what $106,440 would nationally. Nominal pay sits 1.9% above the California state average.
Based on BLS state-level estimates · View source
In 2026, civil engineers in Richmond, California, command an impressive median annual salary of $120,384, reflecting a competitive edge over the national median of $103,492. This strong earning potential is supported by a salary range that spans from $76,764 at the 10th percentile to $186,595 at the 90th percentile. Local compensation estimates incorporate data from the Bureau of Labor Statistics (BLS) and account for regional cost variations. Richmond's job market features a mix of employment sectors, including engineering consulting firms, government roles, and construction companies, each contributing to the salary dynamics experienced in this area.
About the Richmond Market
Salary estimated from California average ($125,000) adjusted for local cost of living.
Salary Breakdown
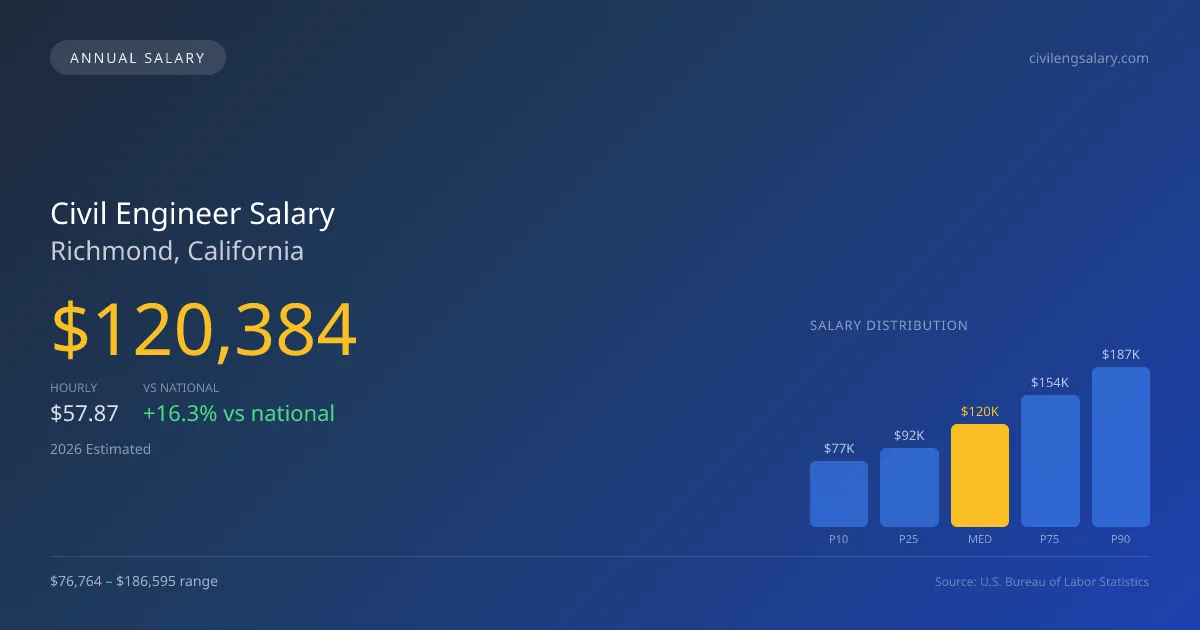
| Percentile | Annual | Hourly |
|---|---|---|
| Entry Level (P10) | $76,764 | $36.91 |
| Lower Range (P25) | $91,603 | $44.04 |
| Median (P50)(typical) | $120,384 | $57.87 |
| Upper Range (P75) | $154,092 | $74.08 |
| Top Earners (P90) | $186,595 | $89.71 |
Median Salary Position
16.32% above the national average
2026 Salary Percentile Distribution in Richmond
In Richmond, CA, the civil engineer salary spread from the 10th to 90th percentile is $109,831 (2026 est.). At $120,384, the local median is 16.32% above the national median of $103,492.
Salary Calculator
At 40 hours/week in Richmond: You'd be in the lower-middle range
How Richmond Civil Engineer Pay Compares
Richmond median: $120,384/year (2026)
| Compared To | Median Salary | Richmond Pays |
|---|---|---|
| California Average | $118,139 | +1.90% more |
| National Average | $103,492 | +16.32% more |
Civil Engineers in Richmond, CA earn a median of $120,384 per year (2026 est.), which is 16.32% higher than the national median of $103,492 and 1.90% above the California state average of $118,139.
Cost-of-Living Adjusted Salary
Richmond has a cost of living 13.10% above the national average.
Adjusted salary = nominal × (100 / CoL index). CoL index: 100 = national average.
Richmond, CA has a cost-of-living index of 113.1 (above the national average of 100). While the nominal salary of $120,384 is competitive, the higher cost of living reduces purchasing power to an effective $106,440 — a 11.58% reduction.
Compare Purchasing Power
Select a city to see how your salary compares after cost of living
Select a city above to compare purchasing power
2019 BLS Actual
$101,270
2025 BLS Actual
$117,299
2026 Current Est.
$120,384
2019–2027 Growth
+22.0%
Salary Trajectory for Civil Engineers in Richmond (2019–2027)
2019–2025: actual BLS OEWS data for this metro area. 2026+: CAGR 2.63% projection.
| Year | Annual Salary | Status |
|---|---|---|
| 2019 | $101,270 | Actual |
| 2020 | $103,026 | Actual |
| 2021 | $102,421 | Actual |
| 2022 | $104,620 | Actual |
| 2023 | $111,541 | Actual |
| 2024 | $144,051 | Actual |
| 2025 | $117,299 | Actual |
| 2026(current) | $120,384 | Estimated |
| 2027 | $123,550 | Projected |
Based on 7 years of BLS OEWS data for the Richmond metropolitan area, the median civil engineer salary grew 15.8% from $101,270 (2019) to $117,299 (2025). At a 2.63% compound annual growth rate, salaries are projected to reach $123,550 by 2027 — a total increase of $22,280 (22.00%) from 2019.
Note: Historical values (2019–2025) are actual BLS OEWS figures for the Richmond metropolitan area, sourced from annual Occupational Employment and Wage Statistics surveys. 2026–2026 figures are current estimates, and 2027 values are projections, calculated using a 2.63% CAGR derived from 7-year BLS historical data. Actual salaries may vary based on employer, experience, certifications, and local market conditions.
Salary by Experience Level
| Experience | Estimated Salary Range |
|---|---|
| 0-2 years (New Graduate) | $76,764 – $91,603 |
| 3-5 years (Mid Career) | $91,603 – $120,384 |
| 5+ years (Experienced) | $120,384 – $154,092 |
| 10+ years (Top Earner) | $154,092 – $186,595 |
CE, PE salary ranges estimated from BLS percentile data. Individual civil engineer compensation varies by employer, certifications, and specialization.
Civil Engineer Job Market in Richmond
Among the 25 civil engineers employed in Richmond, the cost of living index at 113.1 indicates that salaries need to accommodate higher living expenses. Consequently, while jobs at top-tier consulting firms like AECOM and Jacobs often result in higher pay, consolidations in the consulting sector can elevate competition among local and mid-tier firms. The divergence in compensation is significantly influenced by factors such as professional licensure—having a PE license can lead to a substantial salary increase—specialization in high-demand areas like structural and geotechnical engineering, and the operational tier of the employer. Infrastructure initiatives funded by the Bipartisan Infrastructure Law are also driving demand, making this an opportune moment for civil engineers looking to maximize their earning potential in Richmond, CA. Understanding these dynamics is key for professionals aiming to advance their careers and enhance their civil engineer pay in Richmond, CA.
More salary data for Richmond, CA:
Frequently Asked Questions
How much do civil engineers make in Richmond, CA in 2026?
Is Richmond, CA a good place to work as a civil engineer?
Can civil engineers make $100K in Richmond?
What is the cost-of-living adjusted civil engineer salary in Richmond?
How much does a civil engineer make per hour in Richmond?
Related Pages
Compare Salaries
Career Resources
Nearby Cities in California
Written by Jordan Chen, P.E.
Career Analyst
Jordan Chen has 10 years of experience in structural engineering. He works primarily in urban infrastructure projects.
Methodology & Data Source
Salary figures on this page are 2026 projections based on the Bureau of Labor Statistics Occupational Employment and Wage Statistics (OEWS) survey, May 2026 release. The BLS reported a median annual salary of $117,299 for civil engineersin the Richmond metropolitan area. A 2.63% compound annual growth rate (CAGR), calculated from 6-year national BLS wage trends, was applied to project current 2026 compensation. Percentile ranges (P10–P90) represent the full salary distribution across experience levels and practice settings in this market.
Data Sources & Methodology
Salary data for Richmond is estimated from official BLS state-level occupational wage data (2025), adjusted for regional cost-of-living differences using BEA RPP (Regional Price Parities).
2026 figures are projected from 2025 BLS data using a compound annual growth rate (CAGR) of 2.63%, derived from historical BLS wage trends for civil engineers (SOC 17-2051).
Compiled and verified by Jordan Chen, P.E., a licensed civil engineer with 10+ years of clinical experience. · View source data at BLS.gov