Civil Engineer Salary in Turlock, CA: $115,539 (2026)
Quick Answer:A full-time civil engineer in Turlock, CA earns a median $115,539/year (≈ $55.54/hour) in nominal terms for 2026 — projected from BLS OEWS 2025 (SOC 17-2051). Once you factor in Turlock's price level (13% above national, BEA RPP 113.1), that paycheck buys what $102,156 would nationally. Nominal pay sits 2.2% below the California state average.
Based on BLS state-level estimates · View source
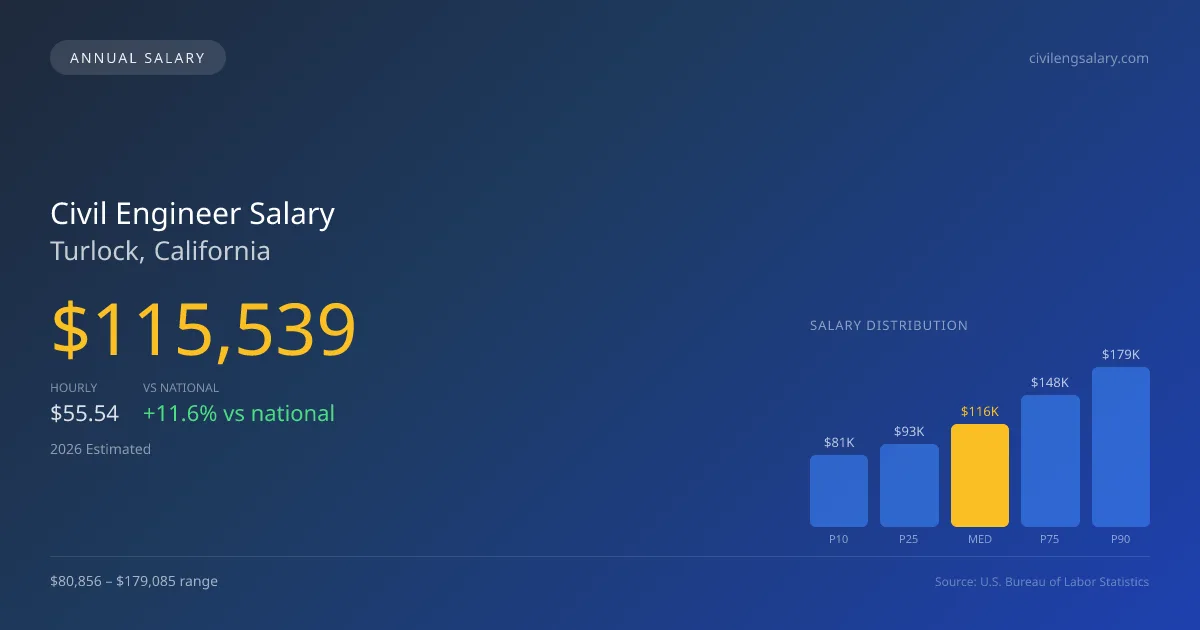
In 2026, civil engineers in Turlock, California, can expect a median annual salary of $115,539, which is significantly above the national median of $103,492. This local salary reflects the impact of the Bipartisan Infrastructure Law (BIL), which has driven increased investment in infrastructure projects and subsequently shaped the hiring patterns within this sector. Salaries for civil engineers in Turlock range from $80,856 at the lower end (P10) to as high as $179,085 at the upper end (P90), demonstrating a robust compensation framework that caters to varying levels of experience and specialization. These figures, derived from 2025 BLS data projected to 2026, take regional cost adjustments into account, highlighting the competitive nature of the job market in Turlock.
About the Turlock Market
Salary estimated from California average ($125,000) adjusted for local cost of living.
Salary Breakdown
| Percentile | Annual | Hourly |
|---|---|---|
| Entry Level (P10) | $80,856 | $38.88 |
| Lower Range (P25) | $92,806 | $44.62 |
| Median (P50)(typical) | $115,539 | $55.54 |
| Upper Range (P75) | $147,890 | $71.10 |
| Top Earners (P90) | $179,085 | $86.10 |
Median Salary Position
11.64% above the national average
2026 Salary Percentile Distribution in Turlock
In Turlock, CA, the civil engineer salary spread from the 10th to 90th percentile is $98,229 (2026 est.). At $115,539, the local median is 11.64% above the national median of $103,492.
Salary Calculator
At 40 hours/week in Turlock: You'd be in the lower-middle range
How Turlock Civil Engineer Pay Compares
Turlock median: $115,539/year (2026)
| Compared To | Median Salary | Turlock Pays |
|---|---|---|
| California Average | $118,138 | -2.20% less |
| National Average | $103,492 | +11.64% more |
Civil Engineers in Turlock, CA earn a median of $115,539 per year (2026 est.), which is 11.64% higher than the national median of $103,492 and 2.20% below the California state average of $118,138.
Cost-of-Living Adjusted Salary
Turlock has a cost of living 13.10% above the national average.
Adjusted salary = nominal × (100 / CoL index). CoL index: 100 = national average.
Turlock, CA has a cost-of-living index of 113.1 (above the national average of 100). While the nominal salary of $115,539 is competitive, the higher cost of living reduces purchasing power to an effective $102,156 — a 11.58% reduction.
Compare Purchasing Power
Select a city to see how your salary compares after cost of living
Select a city above to compare purchasing power
2019 BLS Actual
$97,194
2025 BLS Actual
$112,578
2026 Current Est.
$115,539
2019–2027 Growth
+22.0%
Salary Trajectory for Civil Engineers in Turlock (2019–2027)
2019–2025: actual BLS OEWS data for this metro area. 2026+: CAGR 2.63% projection.
| Year | Annual Salary | Status |
|---|---|---|
| 2019 | $97,194 | Actual |
| 2020 | $98,880 | Actual |
| 2021 | $98,299 | Actual |
| 2022 | $100,409 | Actual |
| 2023 | $107,052 | Actual |
| 2024 | $138,254 | Actual |
| 2025 | $112,578 | Actual |
| 2026(current) | $115,539 | Estimated |
| 2027 | $118,577 | Projected |
Based on 7 years of BLS OEWS data for the Turlock metropolitan area, the median civil engineer salary grew 15.8% from $97,194 (2019) to $112,578 (2025). At a 2.63% compound annual growth rate, salaries are projected to reach $118,577 by 2027 — a total increase of $21,383 (22.00%) from 2019.
Note: Historical values (2019–2025) are actual BLS OEWS figures for the Turlock metropolitan area, sourced from annual Occupational Employment and Wage Statistics surveys. 2026–2026 figures are current estimates, and 2027 values are projections, calculated using a 2.63% CAGR derived from 7-year BLS historical data. Actual salaries may vary based on employer, experience, certifications, and local market conditions.
Salary by Experience Level
| Experience | Estimated Salary Range |
|---|---|
| 0-2 years (New Graduate) | $80,856 – $92,806 |
| 3-5 years (Mid Career) | $92,806 – $115,539 |
| 5+ years (Experienced) | $115,539 – $147,890 |
| 10+ years (Top Earner) | $147,890 – $179,085 |
CE, PE salary ranges estimated from BLS percentile data. Individual civil engineer compensation varies by employer, certifications, and specialization.
Civil Engineer Job Market in Turlock
With 17 civil engineers currently employed in the area, Turlock's market showcases strong local demand. However, the cost of living index is at 113.1, indicating that while salaries are competitive, the purchasing power may be somewhat affected by the relatively higher living expenses compared to the national average. Engineering consulting firms such as Jacobs and AECOM lead in terms of competitive pay, tapping into the ongoing infrastructure spending boom to attract talent. The disparity in wages can often be attributed to factors including the professional engineer (PE) license, specialty skill sets—such as structural or geotechnical engineering—and the tier of the employer, with top-tier consulting firms typically offering higher compensation than smaller firms or governmental agencies. To enhance earning potential, civil engineers in Turlock should consider pursuing advanced credentials like the PE license and seeking roles in high-demand specialties or leadership tracks within robust consulting firms.
More salary data for Turlock, CA:
Frequently Asked Questions
How much do civil engineers make in Turlock, CA in 2026?
Is Turlock, CA a good place to work as a civil engineer?
Can civil engineers make $100K in Turlock?
What is the cost-of-living adjusted civil engineer salary in Turlock?
How much does a civil engineer make per hour in Turlock?
Related Pages
Compare Salaries
Career Resources
Nearby Cities in California
Written by Jordan Chen, P.E.
Career Analyst
Jordan Chen has 10 years of experience in structural engineering. He works primarily in urban infrastructure projects.
Methodology & Data Source
Salary figures on this page are 2026 projections based on the Bureau of Labor Statistics Occupational Employment and Wage Statistics (OEWS) survey, May 2026 release. The BLS reported a median annual salary of $112,578 for civil engineersin the Turlock metropolitan area. A 2.63% compound annual growth rate (CAGR), calculated from 6-year national BLS wage trends, was applied to project current 2026 compensation. Percentile ranges (P10–P90) represent the full salary distribution across experience levels and practice settings in this market.
Data Sources & Methodology
Salary data for Turlock is estimated from official BLS state-level occupational wage data (2025), adjusted for regional cost-of-living differences using BEA RPP (Regional Price Parities).
2026 figures are projected from 2025 BLS data using a compound annual growth rate (CAGR) of 2.63%, derived from historical BLS wage trends for civil engineers (SOC 17-2051).
Compiled and verified by Jordan Chen, P.E., a licensed civil engineer with 10+ years of clinical experience. · View source data at BLS.gov