Civil Engineer Salary in Nixa, MO: $81,784 (2026)
Quick Answer:A full-time civil engineer in Nixa, MO earns a median $81,784/year (≈ $39.32/hour) in nominal terms for 2026 — projected from BLS OEWS 2025 (SOC 17-2051). Once you factor in Nixa's price level (10% below national, BEA RPP 89.6), that paycheck buys what $91,277 would nationally. Nominal pay sits 4.2% below the Missouri state average.
Based on BLS state-level estimates · View source
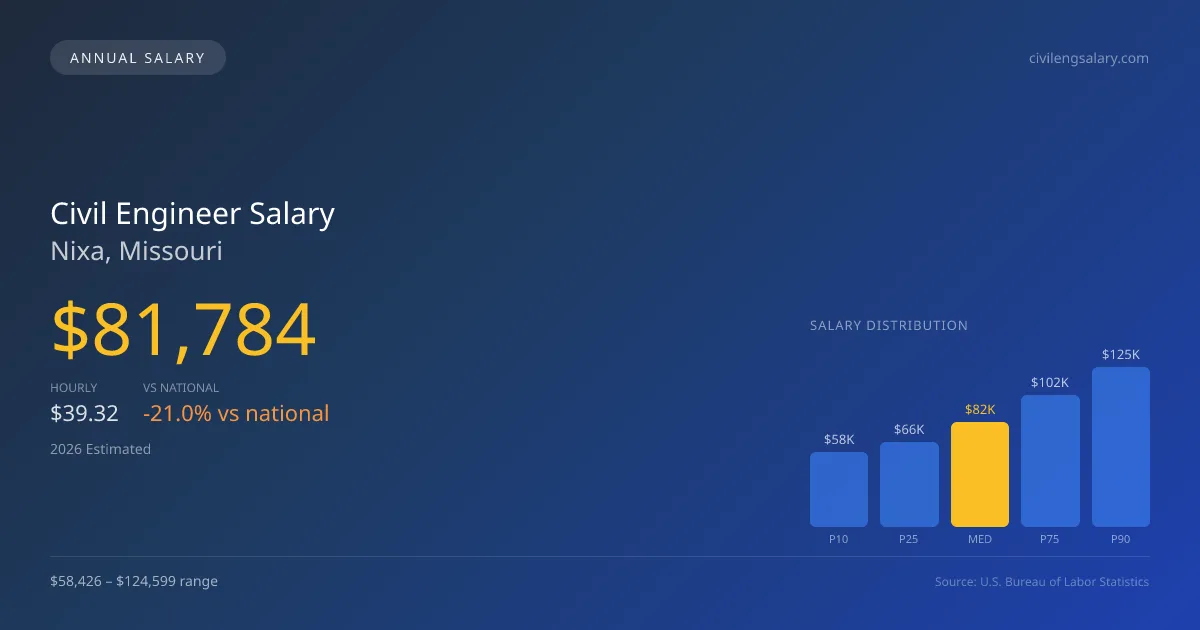
In 2026, professionals working as civil engineers in Nixa, Missouri, can expect a median annual salary of $81,784. This figure, while competitive at the local level, falls below the national median of $103,492, reflecting a pay scale that ranges from $58,426 at the lower tenth percentile to $124,599 at the upper ninetieth. These estimates, derived from BLS state-level data and adjusted for regional price parity, highlight a nuanced local job market where opportunities can vary significantly based on employer type. Those aligned with engineering consulting firms like AECOM or Jacobs typically command higher salaries compared to their counterparts in government roles or small construction firms, which may impact earnings potential for civil engineers in Nixa.
About the Nixa Market
Salary estimated from Missouri average ($88,000) adjusted for local cost of living.
Salary Breakdown
| Percentile | Annual | Hourly |
|---|---|---|
| Entry Level (P10) | $58,426 | $28.09 |
| Lower Range (P25) | $65,903 | $31.68 |
| Median (P50)(typical) | $81,784 | $39.32 |
| Upper Range (P75) | $102,423 | $49.24 |
| Top Earners (P90) | $124,599 | $59.91 |
Median Salary Position
20.98% below the national average
2026 Salary Percentile Distribution in Nixa
In Nixa, MO, the civil engineer salary spread from the 10th to 90th percentile is $66,173 (2026 est.). At $81,784, the local median is 20.98% below the national median of $103,492.
Salary Calculator
At 40 hours/week in Nixa: You'd be in the lower-middle range
How Nixa Civil Engineer Pay Compares
Nixa median: $81,784/year (2026)
| Compared To | Median Salary | Nixa Pays |
|---|---|---|
| Missouri Average | $85,369 | -4.20% less |
| National Average | $103,492 | -20.98% less |
Civil Engineers in Nixa, MO earn a median of $81,784 per year (2026 est.), which is 20.98% lower than the national median of $103,492 and 4.20% below the Missouri state average of $85,369.
Cost-of-Living Adjusted Salary
Nixa has a cost of living 10.40% below the national average, meaning your salary goes further here.
Adjusted salary = nominal × (100 / CoL index). CoL index: 100 = national average.
Nixa, MO has a cost-of-living index of 89.6 (below the national average of 100). A civil engineer earning $81,784 nominally has purchasing power equivalent to $91,277 in an average-cost city — an effective 11.61% boost.
Compare Purchasing Power
Select a city to see how your salary compares after cost of living
Select a city above to compare purchasing power
2019 BLS Actual
$68,798
2025 BLS Actual
$79,688
2026 Current Est.
$81,784
2019–2027 Growth
+22.0%
Salary Trajectory for Civil Engineers in Nixa (2019–2027)
2019–2025: actual BLS OEWS data for this metro area. 2026+: CAGR 2.63% projection.
| Year | Annual Salary | Status |
|---|---|---|
| 2019 | $68,798 | Actual |
| 2020 | $69,992 | Actual |
| 2021 | $69,581 | Actual |
| 2022 | $71,074 | Actual |
| 2023 | $75,776 | Actual |
| 2024 | $75,561 | Actual |
| 2025 | $79,688 | Actual |
| 2026(current) | $81,784 | Estimated |
| 2027 | $83,935 | Projected |
Based on 7 years of BLS OEWS data for the Nixa metropolitan area, the median civil engineer salary grew 15.8% from $68,798 (2019) to $79,688 (2025). At a 2.63% compound annual growth rate, salaries are projected to reach $83,935 by 2027 — a total increase of $15,137 (22.00%) from 2019.
Note: Historical values (2019–2025) are actual BLS OEWS figures for the Nixa metropolitan area, sourced from annual Occupational Employment and Wage Statistics surveys. 2026–2026 figures are current estimates, and 2027 values are projections, calculated using a 2.63% CAGR derived from 7-year BLS historical data. Actual salaries may vary based on employer, experience, certifications, and local market conditions.
Salary by Experience Level
| Experience | Estimated Salary Range |
|---|---|
| 0-2 years (New Graduate) | $58,426 – $65,903 |
| 3-5 years (Mid Career) | $65,903 – $81,784 |
| 5+ years (Experienced) | $81,784 – $102,423 |
| 10+ years (Top Earner) | $102,423 – $124,599 |
CE, PE salary ranges estimated from BLS percentile data. Individual civil engineer compensation varies by employer, certifications, and specialization.
Civil Engineer Job Market in Nixa
With only six civil engineers currently employed in the region, Nixa's job market is relatively small but stable, backed by a cost-of-living index of 89.6, suggesting that residents can stretch their salaries further than in many other parts of the U.S. Among the local employers, top consulting firms and larger construction corporations tend to offer the most lucrative civil engineer pay in Nixa, allowing qualified professionals to make the most of their qualifications. The spread in compensation often hinges on factors such as having a Professional Engineer (PE) license, specialty areas like structural or geotechnical engineering, and the level of experience. Addressing infrastructure initiatives fueled by the Bipartisan Infrastructure Law can provide additional opportunities for salary growth. For those aiming to maximize their income, pursuing advanced certifications like the PE license and targeting high-tier consulting firms can be advantageous in this market.
More salary data for Nixa, MO:
Frequently Asked Questions
How much do civil engineers make in Nixa, MO in 2026?
Is Nixa, MO a good place to work as a civil engineer?
Can civil engineers make $100K in Nixa?
What is the cost-of-living adjusted civil engineer salary in Nixa?
How much does a civil engineer make per hour in Nixa?
Related Pages
Compare Salaries
Career Resources
Nearby Cities in Missouri
Written by Jordan Chen, P.E.
Career Analyst
Jordan Chen has 10 years of experience in structural engineering. He works primarily in urban infrastructure projects.
Methodology & Data Source
Salary figures on this page are 2026 projections based on the Bureau of Labor Statistics Occupational Employment and Wage Statistics (OEWS) survey, May 2026 release. The BLS reported a median annual salary of $79,688 for civil engineersin the Nixa metropolitan area. A 2.63% compound annual growth rate (CAGR), calculated from 6-year national BLS wage trends, was applied to project current 2026 compensation. Percentile ranges (P10–P90) represent the full salary distribution across experience levels and practice settings in this market.
Data Sources & Methodology
Salary data for Nixa is estimated from official BLS state-level occupational wage data (2025), adjusted for regional cost-of-living differences using BEA RPP (Regional Price Parities).
2026 figures are projected from 2025 BLS data using a compound annual growth rate (CAGR) of 2.63%, derived from historical BLS wage trends for civil engineers (SOC 17-2051).
Compiled and verified by Jordan Chen, P.E., a licensed civil engineer with 10+ years of clinical experience. · View source data at BLS.gov