Civil Engineer Salary in Burlington, VT: $100,988 (2026)
Quick Answer:A full-time civil engineer in Burlington, VT earns a median $100,988/year (≈ $48.55/hour) in nominal terms for 2026 — projected from BLS OEWS 2025 (SOC 17-2051). Once you factor in Burlington's price level (1% above national, BEA RPP 100.9), that paycheck buys what $100,039 would nationally. Nominal pay sits 5.7% below the Vermont state average.
Official BLS data · View source
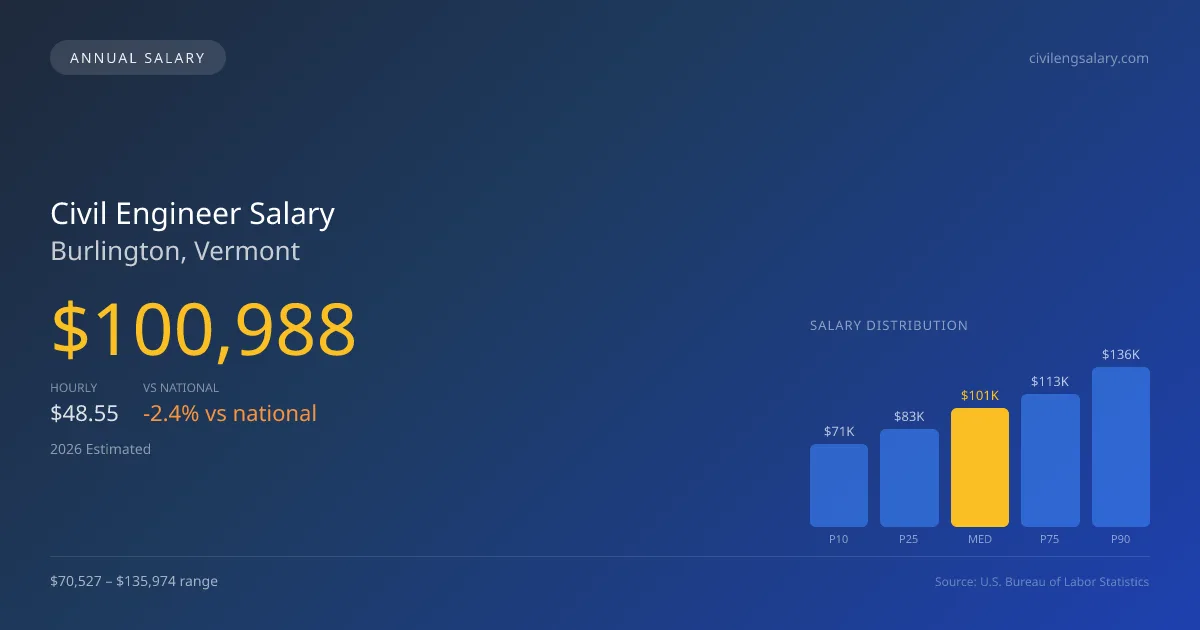
In Burlington, Vermont, the civil engineer salary in Burlington is projected to reach a median of $100,988 by 2026, slightly below the national median of $103,492. This figure reflects the influence of the Bipartisan Infrastructure Law (BIL), which has significantly impacted hiring in the civil engineering sector. The salary range for civil engineers spans from $70,527 at the lower end to $135,974 at the 90th percentile, illustrating a competitive market driven by ongoing infrastructure spending and expansion projects. Based on 2025 BLS OEWS data, projected to 2026, these figures highlight the robust demand for skilled civil engineers in Burlington, making it an attractive location for professionals in the field.
Salary Breakdown
| Percentile | Annual | Hourly |
|---|---|---|
| Entry Level (P10) | $70,527 | $33.91 |
| Lower Range (P25) | $83,264 | $40.03 |
| Median (P50)(typical) | $100,988 | $48.55 |
| Upper Range (P75) | $113,047 | $54.35 |
| Top Earners (P90) | $135,974 | $65.38 |
Median Salary Position
2.42% below the national average
2026 Salary Percentile Distribution in Burlington
In Burlington, VT, the civil engineer salary spread from the 10th to 90th percentile is $65,447 (2026 est.). At $100,988, the local median is 2.42% below the national median of $103,492.
Salary Calculator
At 40 hours/week in Burlington: You'd be in the lower-middle range
How Burlington Civil Engineer Pay Compares
Burlington median: $100,988/year (2026)
| Compared To | Median Salary | Burlington Pays |
|---|---|---|
| Vermont Average | $107,092 | -5.70% less |
| National Average | $103,492 | -2.42% less |
Civil Engineers in Burlington, VT earn a median of $100,988 per year (2026 est.), which is 2.42% lower than the national median of $103,492 and 5.70% below the Vermont state average of $107,092.
Cost-of-Living Adjusted Salary
Burlington has a cost of living 0.95% above the national average.
Adjusted salary = nominal × (100 / CoL index). CoL index: 100 = national average.
Burlington, VT has a cost-of-living index of 100.949 (above the national average of 100). While the nominal salary of $100,988 is competitive, the higher cost of living reduces purchasing power to an effective $100,039 — a 0.94% reduction.
Compare Purchasing Power
Select a city to see how your salary compares after cost of living
Select a city above to compare purchasing power
2019 BLS Actual
$73,370
2025 BLS Actual
$98,400
2026 Current Est.
$100,988
2019–2027 Growth
+41.3%
Salary Trajectory for Civil Engineers in Burlington (2019–2027)
2019–2025: actual BLS OEWS data for this metro area. 2026+: CAGR 2.63% projection.
| Year | Annual Salary | Status |
|---|---|---|
| 2019 | $73,370 | Actual |
| 2020 | $75,650 | Actual |
| 2021 | $77,610 | Actual |
| 2022 | $74,330 | Actual |
| 2023 | $77,760 | Actual |
| 2024 | $94,100 | Actual |
| 2025 | $98,400 | Actual |
| 2026(current) | $100,988 | Estimated |
| 2027 | $103,644 | Projected |
Based on 7 years of BLS OEWS data for the Burlington metropolitan area, the median civil engineer salary grew 34.1% from $73,370 (2019) to $98,400 (2025). At a 2.63% compound annual growth rate, salaries are projected to reach $103,644 by 2027 — a total increase of $30,274 (41.26%) from 2019.
Note: Historical values (2019–2025) are actual BLS OEWS figures for the Burlington metropolitan area, sourced from annual Occupational Employment and Wage Statistics surveys. 2026–2026 figures are current estimates, and 2027 values are projections, calculated using a 2.63% CAGR derived from 7-year BLS historical data. Actual salaries may vary based on employer, experience, certifications, and local market conditions.
Salary by Experience Level
| Experience | Estimated Salary Range |
|---|---|
| 0-2 years (New Graduate) | $70,527 – $83,264 |
| 3-5 years (Mid Career) | $83,264 – $100,988 |
| 5+ years (Experienced) | $100,988 – $113,047 |
| 10+ years (Top Earner) | $113,047 – $135,974 |
CE, PE salary ranges estimated from BLS percentile data. Individual civil engineer compensation varies by employer, certifications, and specialization.
Civil Engineer Job Market in Burlington
The job market for civil engineers in Burlington is solid, with approximately 250 professionals actively employed in the area. However, the cost of living index stands at 100.949, suggesting that while salaries may be competitive, the purchasing power can be somewhat constrained. Leading employers in the region, such as firms like AECOM, Jacobs, and Stantec, tend to offer the most lucrative compensation packages, particularly for engineers with specialized skills or PE licensure. Variability in civil engineer pay in Burlington VT often stems from differences in firm types, project scopes, and whether the work is contract-based, government-funded, or private sector-driven. To maximize earning potential, it benefits engineers to pursue specialty certifications or licensure, establish connections within top consulting firms, and stay informed on local infrastructure initiatives that may create new opportunities.
More salary data for Burlington, VT:
Frequently Asked Questions
How much do civil engineers make in Burlington, VT in 2026?
Is Burlington, VT a good place to work as a civil engineer?
Can civil engineers make $100K in Burlington?
What is the cost-of-living adjusted civil engineer salary in Burlington?
How much does a civil engineer make per hour in Burlington?
Related Pages
Compare Salaries
Career Resources
Nearby Cities in Vermont
Written by Jordan Chen, P.E.
Career Analyst
Jordan Chen has 10 years of experience in structural engineering. He works primarily in urban infrastructure projects.
Methodology & Data Source
Salary figures on this page are 2026 projections based on the Bureau of Labor Statistics Occupational Employment and Wage Statistics (OEWS) survey, May 2026 release. The BLS reported a median annual salary of $98,400 for civil engineersin the Burlington metropolitan area. A 2.63% compound annual growth rate (CAGR), calculated from 6-year national BLS wage trends, was applied to project current 2026 compensation. Percentile ranges (P10–P90) represent the full salary distribution across experience levels and practice settings in this market.
Data Sources & Methodology
Source: BLS, OEWS, 7-year dataset (–). Per-city data from annual BLS metropolitan area surveys.
2026 figures are projected from 2025 BLS data using a compound annual growth rate (CAGR) of 2.63%, derived from historical BLS wage trends for civil engineers (SOC 17-2051).
Compiled and verified by Jordan Chen, P.E., a licensed civil engineer with 10+ years of clinical experience. · View source data at BLS.gov