Civil Engineer Salary in Richmond, VA: $93,701 (2026)
Quick Answer:A full-time civil engineer in Richmond, VA earns a median $93,701/year (≈ $45.05/hour) in nominal terms for 2026 — projected from BLS OEWS 2025 (SOC 17-2051). Once you factor in Richmond's price level (2% below national, BEA RPP 97.9), that paycheck buys what $95,752 would nationally. Nominal pay sits 3.1% below the Virginia state average.
Official BLS data · View source
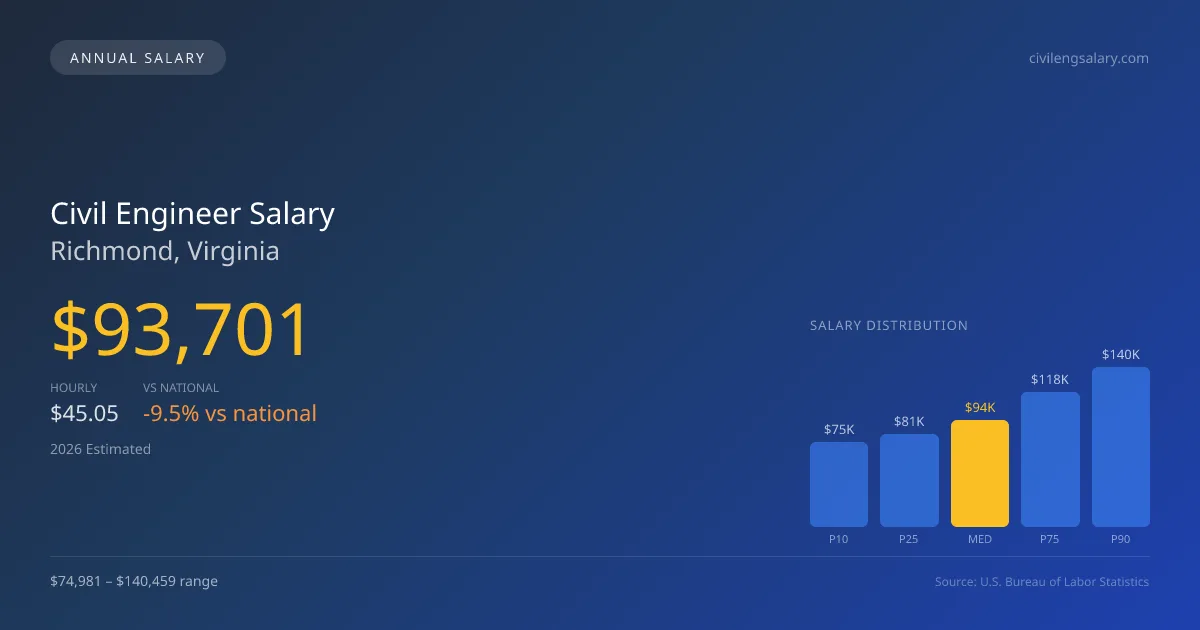
For 2026, civil engineers in Richmond, Virginia, can expect a median annual salary of $93,701, reflecting a 9.46% difference compared to the national median of $103,492. Salaries in the region range from $74,981 at the lower end (P10) to a robust $140,459 at the high end (P90). These figures, derived from official Bureau of Labor Statistics (BLS) OEWS surveys, highlight the competitive nature of civil engineering pay in Richmond. Earning potential increases with licensure progression from Engineer in Training (EIT) to Professional Engineer (PE), significantly impacting senior roles and project management positions in an evolving job market driven by infrastructure spending.
Salary Breakdown
| Percentile | Annual | Hourly |
|---|---|---|
| Entry Level (P10) | $74,981 | $36.05 |
| Lower Range (P25) | $81,252 | $39.06 |
| Median (P50)(typical) | $93,701 | $45.05 |
| Upper Range (P75) | $118,497 | $56.97 |
| Top Earners (P90) | $140,459 | $67.53 |
Median Salary Position
9.46% below the national average
2026 Salary Percentile Distribution in Richmond
In Richmond, VA, the civil engineer salary spread from the 10th to 90th percentile is $65,478 (2026 est.). At $93,701, the local median is 9.46% below the national median of $103,492.
Salary Calculator
At 40 hours/week in Richmond: You'd be in the lower-middle range
How Richmond Civil Engineer Pay Compares
Richmond median: $93,701/year (2026)
| Compared To | Median Salary | Richmond Pays |
|---|---|---|
| Virginia Average | $96,699 | -3.10% less |
| National Average | $103,492 | -9.46% less |
Civil Engineers in Richmond, VA earn a median of $93,701 per year (2026 est.), which is 9.46% lower than the national median of $103,492 and 3.10% below the Virginia state average of $96,699.
Cost-of-Living Adjusted Salary
Richmond has a cost of living 2.14% below the national average, meaning your salary goes further here.
Adjusted salary = nominal × (100 / CoL index). CoL index: 100 = national average.
Richmond, VA has a cost-of-living index of 97.858 (below the national average of 100). A civil engineer earning $93,701 nominally has purchasing power equivalent to $95,752 in an average-cost city — an effective 2.19% boost.
Compare Purchasing Power
Select a city to see how your salary compares after cost of living
Select a city above to compare purchasing power
2019 BLS Actual
$84,800
2025 BLS Actual
$91,300
2026 Current Est.
$93,701
2019–2027 Growth
+13.4%
Salary Trajectory for Civil Engineers in Richmond (2019–2027)
2019–2025: actual BLS OEWS data for this metro area. 2026+: CAGR 2.63% projection.
| Year | Annual Salary | Status |
|---|---|---|
| 2019 | $84,800 | Actual |
| 2020 | $85,300 | Actual |
| 2021 | $80,550 | Actual |
| 2022 | $84,590 | Actual |
| 2023 | $84,360 | Actual |
| 2024 | $88,920 | Actual |
| 2025 | $91,300 | Actual |
| 2026(current) | $93,701 | Estimated |
| 2027 | $96,166 | Projected |
Based on 7 years of BLS OEWS data for the Richmond metropolitan area, the median civil engineer salary grew 7.7% from $84,800 (2019) to $91,300 (2025). At a 2.63% compound annual growth rate, salaries are projected to reach $96,166 by 2027 — a total increase of $11,366 (13.40%) from 2019.
Note: Historical values (2019–2025) are actual BLS OEWS figures for the Richmond metropolitan area, sourced from annual Occupational Employment and Wage Statistics surveys. 2026–2026 figures are current estimates, and 2027 values are projections, calculated using a 2.63% CAGR derived from 7-year BLS historical data. Actual salaries may vary based on employer, experience, certifications, and local market conditions.
Salary by Experience Level
| Experience | Estimated Salary Range |
|---|---|
| 0-2 years (New Graduate) | $74,981 – $81,252 |
| 3-5 years (Mid Career) | $81,252 – $93,701 |
| 5+ years (Experienced) | $93,701 – $118,497 |
| 10+ years (Top Earner) | $118,497 – $140,459 |
CE, PE salary ranges estimated from BLS percentile data. Individual civil engineer compensation varies by employer, certifications, and specialization.
Civil Engineer Job Market in Richmond
In Richmond, approximately 1,680 civil engineers contribute to a strong local job market, which is further enhanced by a cost-of-living index of 97.858, indicating affordability compared to many U.S. urban centers. Top-paying employers here include major engineering consulting firms like AECOM, Jacobs, and WSP, alongside Fortune 500 companies such as Bechtel and Fluor. The salary spectrum reflects variations in specialization, with structural, geotechnical, and transportation engineers often earning a premium. High salaries are typically reserved for those holding a PE license, which is crucial for accessing senior positions. As infrastructure projects receive funding through the Bipartisan Infrastructure Law, engineers can capitalize on growing opportunities. To maximize potential earnings in Richmond, professionals should consider aligning with top-tier firms, pursuing relevant certifications, and developing specialized skills that cater to current market demands.
More salary data for Richmond, VA:
Frequently Asked Questions
How much do civil engineers make in Richmond, VA in 2026?
Is Richmond, VA a good place to work as a civil engineer?
Can civil engineers make $100K in Richmond?
What is the cost-of-living adjusted civil engineer salary in Richmond?
How much does a civil engineer make per hour in Richmond?
Related Pages
Compare Salaries
Career Resources
Nearby Cities in Virginia
Written by Jordan Chen, P.E.
Career Analyst
Jordan Chen has 10 years of experience in structural engineering. He works primarily in urban infrastructure projects.
Methodology & Data Source
Salary figures on this page are 2026 projections based on the Bureau of Labor Statistics Occupational Employment and Wage Statistics (OEWS) survey, May 2026 release. The BLS reported a median annual salary of $91,300 for civil engineersin the Richmond metropolitan area. A 2.63% compound annual growth rate (CAGR), calculated from 6-year national BLS wage trends, was applied to project current 2026 compensation. Percentile ranges (P10–P90) represent the full salary distribution across experience levels and practice settings in this market.
Data Sources & Methodology
Source: BLS, OEWS, 7-year dataset (–). Per-city data from annual BLS metropolitan area surveys.
2026 figures are projected from 2025 BLS data using a compound annual growth rate (CAGR) of 2.63%, derived from historical BLS wage trends for civil engineers (SOC 17-2051).
Compiled and verified by Jordan Chen, P.E., a licensed civil engineer with 10+ years of clinical experience. · View source data at BLS.gov