Civil Engineer Salary in Washington: $117,065 (2026)
Quick Answer:Across Washington's 50 metropolitan areas, the average median civil engineer pay sits at $117,065/year heading into 2026 — a figure projected from 2025 BLS OEWS wage data for SOC 17-2051. Because Washington sits at BEA RPP 107.4 (7% above the U.S. baseline), that statewide median translates to roughly $108,999 in nationally-comparable purchasing power. Highest-paying metros: Richland ($123,899), Walla Walla ($123,030), Kennewick ($121,370).
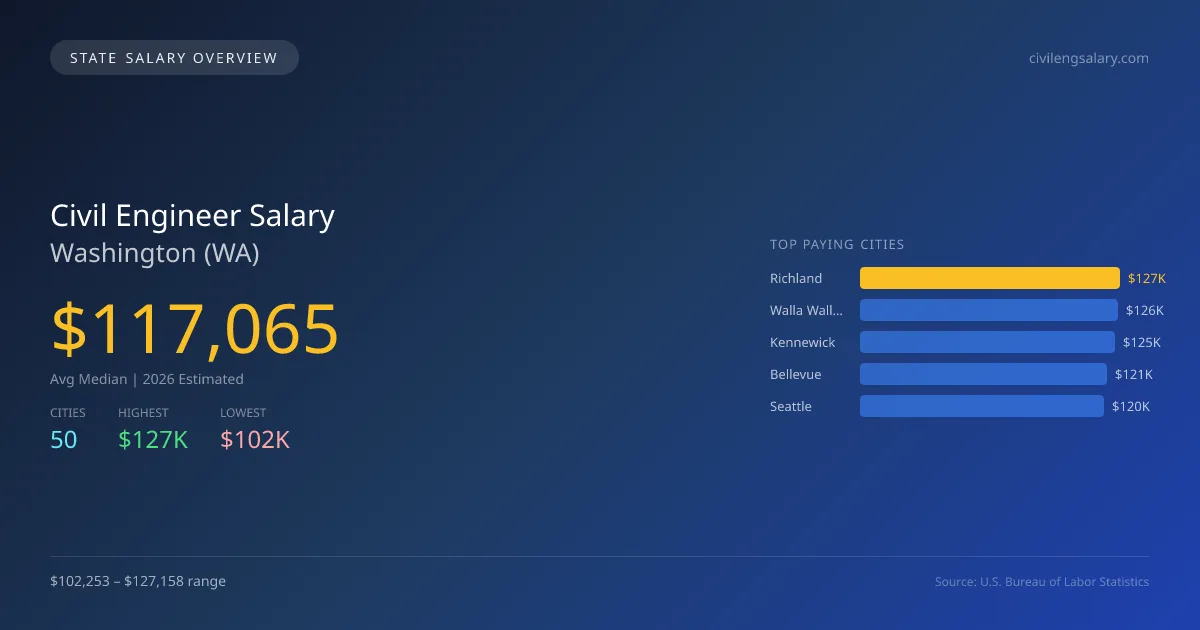
In 2026, the average civil engineer in Washington will earn a median salary of $117,065, surpassing the national median of $103,492 by 13.1%. This salary variance reflects regional demand, project scope, and cost of living among the state's diverse metro areas. The highest-paying city for civil engineers is Richland, offering $127,158, while Tukwila presents the lowest at $102,253, highlighting a gap of $24,905. Factors influencing these differences include local market conditions, infrastructure projects, and varying demand for civil engineering expertise across the state. Washington has specific licensing requirements and scope of practice laws that can affect salary and job opportunities. The projected annual growth rate for civil engineering jobs in the state is 2.63%, indicating a steady demand for professionals in this field. Significant cities driving employment include Walla Walla at $126,266, Kennewick at $124,562, Bellevue at $120,715, and Seattle at $119,543. The solid job market and favorable salary conditions reflect a healthy outlook for aspiring civil engineers in Washington, making it a strategically advantageous location for career development in this profession.
Washington Civil Engineer Salary Range
Overall salary range in Washington: $69,180 (lowest entry-level) to $197,094 (highest top earner)
Washington vs National Average
Washington civil engineers earn 13.12% more than the national median (+$13,573/year difference).
Washington Civil Engineer Salary Distribution (2026)
Civil Engineer salaries in Washington range from $83,689 (entry-level, 10th percentile) to $162,259 (top earners, 90th percentile), with a median of $117,065. The Washington median is $13,573 above the US national median of $103,492. The average hourly rate is $56.28/hr. Approximately 11,604 civil engineers are employed across 50 cities.
2019 BLS Actual
$89,572
2025 BLS Actual
$114,065
2026 Current Est.
$117,065
2019–2027 Growth
+34.1%
Salary Trajectory for Civil Engineers in Washington (2019–2027)
2019–2025: actual BLS OEWS data for this metro area. 2026+: CAGR 2.63% projection.
| Year | Annual Salary | Status |
|---|---|---|
| 2019 | $89,572 | Actual |
| 2020 | $90,094 | Actual |
| 2021 | $95,643 | Actual |
| 2022 | $96,092 | Actual |
| 2023 | $99,299 | Actual |
| 2024 | $107,615 | Actual |
| 2025 | $114,065 | Actual |
| 2026(current) | $117,065 | Estimated |
| 2027 | $120,144 | Projected |
Based on 7 years of BLS OEWS data for the Washington metropolitan area, the median civil engineer salary grew 27.3% from $89,572 (2019) to $114,065 (2025). At a 2.63% compound annual growth rate, salaries are projected to reach $120,144 by 2027 — a total increase of $30,572 (34.13%) from 2019.
Note: Historical values (2019–2025) are actual BLS OEWS figures for the Washington metropolitan area, sourced from annual Occupational Employment and Wage Statistics surveys. 2026–2026 figures are current estimates, and 2027 values are projections, calculated using a 2.63% CAGR derived from 7-year BLS historical data. Actual salaries may vary based on employer, experience, certifications, and local market conditions.
Top 5 Highest Paying Cities in Washington
Lowest Paying Cities in Washington
| City | Median Salary |
|---|---|
| Tukwila | $102,253 |
| Mountlake Terrace | $102,411 |
| Yakima | $103,153 |
| Wenatchee | $103,153 |
| Spokane | $103,153 |
Best Value Cities for Civil Engineers in Washington
When adjusted for local cost of living, these Washington cities offer the most purchasing power for civil engineers.
| City | Nominal Salary | CoL Index | Adjusted Salary |
|---|---|---|---|
| Walla Walla | $126,266 | 98.519 | $128,164 |
| Kennewick | $124,562 | 100.079 | $124,464 |
| Richland | $127,158 | 107.4 | $118,397 |
| Bremerton | $119,266 | 105.607 | $112,934 |
| Bellevue | $120,715 | 107.4 | $112,398 |
Adjusted salary = nominal salary × (100 / CoL index). CoL index: 100 = national average. Lower index = lower cost of living.
Salary by Experience Level in Washington
| Experience Level | Estimated Annual |
|---|---|
| Entry Level (0-2 years) | $83,689 |
| Mid Career (3-7 years) | $117,065 |
| Experienced (7+ years) | $162,259 |
Estimates based on BLS percentile data averaged across Washington metro areas. Individual pay varies by employer, certifications, and specialization.
All 50 Cities in Washington
| # | City | Median Salary |
|---|---|---|
| 1 | Richland | $127,158 |
| 2 | Walla Walla | $126,266 |
| 3 | Kennewick | $124,562 |
| 4 | Bellevue | $120,715 |
| 5 | Seattle | $119,543 |
| 6 | Bremerton | $119,266 |
| 7 | Tacoma | $117,549 |
| 8 | Renton | $113,514 |
| 9 | Everett | $112,415 |
| 10 | Tumwater | $112,104 |
| 11 | Marysville | $111,573 |
| 12 | Olympia | $111,087 |
| 13 | Shoreline | $110,959 |
| 14 | Bellingham | $110,625 |
| 15 | Redmond | $110,522 |
| 16 | Kent | $110,431 |
| 17 | Kirkland | $110,250 |
| 18 | Lacey | $110,175 |
| 19 | Burien | $110,110 |
| 20 | Vancouver | $109,777 |
| 21 | Federal Way | $109,626 |
| 22 | Des Moines | $109,603 |
| 23 | Auburn | $109,348 |
| 24 | Lakewood | $109,304 |
| 25 | Issaquah | $109,241 |
| 26 | Sammamish | $108,524 |
| 27 | University Place | $108,486 |
| 28 | SeaTac | $108,401 |
| 29 | Pasco | $107,937 |
| 30 | Edmonds | $107,276 |
| 31 | Lake Stevens | $106,993 |
| 32 | Lynnwood | $106,924 |
| 33 | Moses Lake | $106,718 |
| 34 | Bothell | $106,641 |
| 35 | Pullman | $106,169 |
| 36 | Puyallup | $105,929 |
| 37 | Ellensburg | $105,530 |
| 38 | Longview | $105,452 |
| 39 | Maple Valley | $105,242 |
| 40 | Spokane Valley | $105,138 |
| 41 | Camas | $104,975 |
| 42 | Oak Harbor | $104,533 |
| 43 | Mount Vernon | $103,964 |
| 44 | Kenmore | $103,858 |
| 45 | Covington | $103,850 |
| 46 | Spokane | $103,153 |
| 47 | Wenatchee | $103,153 |
| 48 | Yakima | $103,153 |
| 49 | Mountlake Terrace | $102,411 |
| 50 | Tukwila | $102,253 |
More Washington Salary Data
Hourly Rates
Explore civil engineer hourly pay in Washington cities.
Senior / Experienced
Top earner salaries for experienced civil engineers.
Compare Cities in Washington
View all comparisons →Explore More Civil Engineer Salary Data
Frequently Asked Questions
How much do civil engineers make in Washington in 2026?
What is the highest paying city for civil engineers in Washington?
How does Washington civil engineer pay compare to the national average?
What is the entry-level civil engineer salary in Washington?
How many civil engineers are employed in Washington?
Which Washington city offers the best value for civil engineers?
Written by Jordan Chen, P.E.
Career Analyst
Jordan Chen has 10 years of experience in structural engineering. He works primarily in urban infrastructure projects.
Methodology & Data Source
Statewide salary figures on this page are 2026 projections based on the Bureau of Labor Statistics Occupational Employment and Wage Statistics (OEWS) survey, May 2026 release. A 2.63% compound annual growth rate (CAGR), derived from 6-year national BLS wage trends, was applied to each metro area's reported salary to estimate current 2026 civil engineer compensation across Washington. State averages are employment-weighted across 50 metro areas — larger metro areas with more civil engineerscontribute proportionally more to the average, producing figures that better reflect typical compensation. Individual pay varies by city, employer, certifications, and experience.
Data Sources & Methodology
Source: BLS, OEWS, 7-year dataset (–). Per-city data from annual BLS metropolitan area surveys.
2026 figures are projected from 2025 BLS data using a compound annual growth rate (CAGR) of 2.63%, derived from historical BLS wage trends for civil engineers (SOC 17-2051).
Compiled and verified by Jordan Chen, P.E., a licensed civil engineer with 10+ years of clinical experience. · View source data at BLS.gov