Senior Civil Engineer Salary in San Clemente, CA: $182,117 (2026)
Quick Answer:The top tier of civil engineers working in San Clemente, CA — those at or above the 90th percentile — pull in $182,117/year or more for 2026, based on BLS OEWS 2025 estimates for SOC 17-2051. Strip back San Clemente's price premium (BEA RPP 113.1, 13% above national) and that top-decile pay carries the same buying power as $161,023 in average-cost America. The 55% spread above city median typically rewards 7+ years of practice or specialty credentials.
Based on BLS state-level estimates · View source
In 2026, senior civil engineers in San Clemente can anticipate salaries that place them well above the national average, with a median annual salary of $117,495. The potential for top earners is significant, with the 90th percentile reaching $182,117. This advanced pay reflects the considerable experience premium available to those with over seven years in the field, highlighting the substantial gap between the median salary and the earnings of the highest-paid professionals. To achieve such top-tier compensation, civil engineers typically engage in specialized training, obtain advanced credentials such as a Professional Engineer (PE) license, and build a robust professional network, often through affiliations with firms like AECOM or Jacobs that stand at the apex of the industry in San Clemente, CA.
About the San Clemente Market
Salary estimated from California average ($125,000) adjusted for local cost of living.
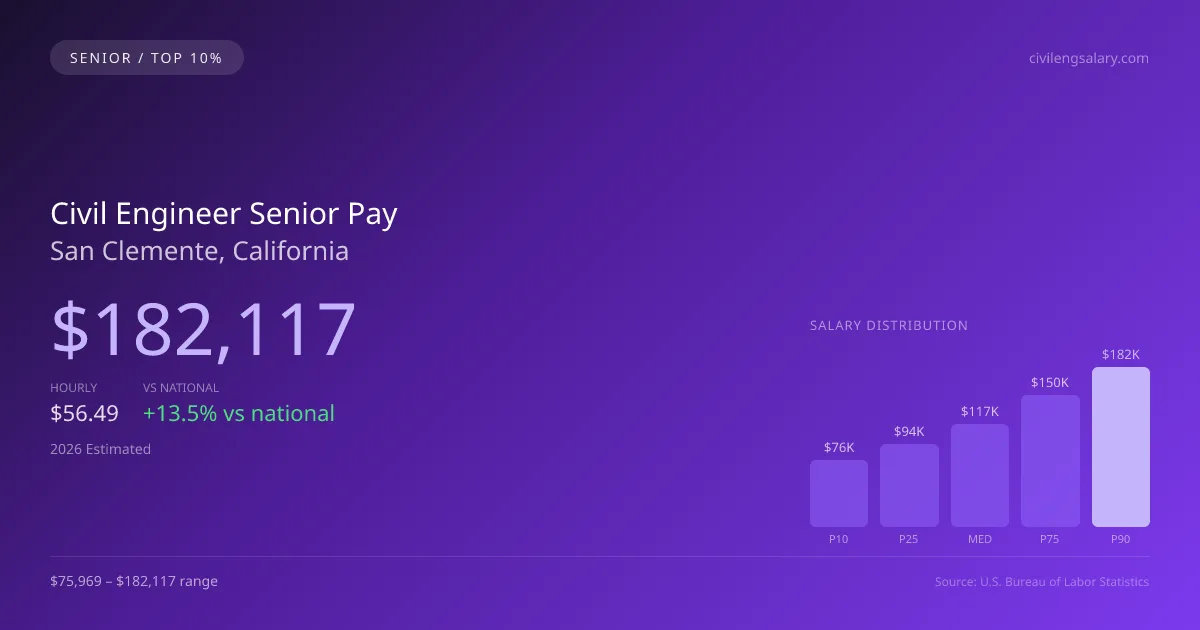
2026 Salary Percentile Distribution in San Clemente
Experienced civil engineers at the top of the pay scale in San Clemente earn between $150,394 and $182,117 per year (2026 est.). This $106,148 range from 10th to 90th percentile reflects significant earnings potential growth over a career. The San Clemente median of $117,495 sits 13.53% above the US median.
Top CE, PE Salary Comparison
| Level | San Clemente | National |
|---|---|---|
| Median (P50) | $117,495 | $103,492 |
| 75th Percentile | $150,394 | $133,091 |
| 90th Percentile (Top 10%) | $182,117 | $167,513 |
In San Clemente, experienced civil engineers (P90) earn 55.00% more than the local median — reflecting the significant value of specialization and tenure in this market.
What Drives Top Civil Engineer Pay in San Clemente
Advanced Certifications in California
CA civil engineers with additional specialty certifications within the civil engineering field earn significantly above the $117,495 median. Expanded-scope credentials are increasingly valued by San Clemente employers.
Specialty Focus
Civil Engineers focusing on high-acuity or specialty areas within the civil engineering field in San Clemente command premium compensation, often reaching the $150,394–$182,117 range.
Large Health-System & Multi-Site Experience
Large hospital systems and multi-site employers in the San Clemente metro area often pay above-market rates for experienced civil engineers who demonstrate efficiency and leadership.
Employer Loyalty & Patient Relationships
Long-tenured civil engineers in San Clemente with established relationships have strong negotiating leverage. In this developing market, retention bonuses and annual raises are common for top performers.
Continuing Education & Leadership
Civil Engineers in California who pursue advanced degrees, mentor junior staff, or lead clinical education programs position themselves for the highest compensation tiers and management roles.
Civil Engineer Career & Wage Growth Path in San Clemente
Clinical Civil Engineer
0-5 yearsSenior/Lead Civil Engineer
5-10 yearsCivil Engineer Department Manager
10+ yearsEducator / Specialty Leadership
AdvancedSan Clemente ranks #82 of 158 California cities for top earner civil engineer salary (90th percentile: $182,117).
Top 10% civil engineer compensation in San Clemente ($182,117) is 0.74% below the California average P90 ($183,474).
2019 BLS Actual
$157,163
2025 BLS Actual
$177,450
2026 Current Est.
$182,117
2019–2027 Growth
+18.9%
Salary Trajectory for Civil Engineers in San Clemente (2019–2027)
2019–2025: actual BLS OEWS data for this metro area. 2026+: CAGR 2.63% projection.
| Year | Annual Salary | Status |
|---|---|---|
| 2019 | $157,163 | Actual |
| 2020 | $157,435 | Actual |
| 2021 | $144,943 | Actual |
| 2022 | $150,781 | Actual |
| 2023 | $163,773 | Actual |
| 2024 | $217,921 | Actual |
| 2025 | $177,450 | Actual |
| 2026(current) | $182,117 | Estimated |
| 2027 | $186,907 | Projected |
Top-earning civil engineers (90th percentile) in San Clemente saw their compensation grow 12.9% from $157,163 in 2019 to $177,450 in 2025, based on 7 years of BLS OEWS data for this metropolitan area. At a 2.63% annual growth rate, senior-level pay is projected to reach $186,907 by 2027, reflecting continued demand for clinical expertise and expanded-function credentials.
Note: Historical values (2019–2025) are actual BLS OEWS figures for the San Clemente metropolitan area, sourced from annual Occupational Employment and Wage Statistics surveys. 2026–2026 figures are current estimates, and 2027 values are projections, calculated using a 2.63% CAGR derived from 7-year BLS historical data. Actual salaries may vary based on employer, experience, certifications, and local market conditions.
Maximizing Your Civil Engineer Earnings in San Clemente
Senior civil engineers specializing in areas such as transportation, structural engineering, and environmental management often see significant pay differentiation in San Clemente, CA. Compensation dynamics can vary widely depending on the employer type, with top-tier engineering consulting firms providing higher salaries compared to local public works or governmental positions. Furthermore, career advancement within this realm can lead from roles as a project manager to becoming a principal or industry partner, enhancing earning potential. Advanced qualifications, including the CE and PE licenses, are usually essential for accessing higher salary bands, especially given the upward trends driven by the Bipartisan Infrastructure Law (BIL). Engineers pursuing paths in prominent construction firms like Bechtel or Fluor also tend to secure lucrative opportunities, benefiting from infrastructure investments while maintaining flexibility between government versus private sector work. These variations can ultimately affect overall career trajectories, compensation structures, and job satisfaction in the growing civil engineer market.
More salary data for San Clemente, CA:
Frequently Asked Questions
How much do experienced civil engineers make in San Clemente in 2026?
What drives higher civil engineer pay in San Clemente?
What certifications boost civil engineer salary in San Clemente?
Can experienced civil engineers make six figures in San Clemente?
How much does civil engineer salary increase over time in San Clemente?
Related Pages
Compare Salaries
Career Resources
Nearby Cities in California
Written by Jordan Chen, P.E.
Career Analyst
Jordan Chen has 10 years of experience in structural engineering. He works primarily in urban infrastructure projects.
Methodology & Data Source
Top-earner salary figures on this page are 2026 projections derived from the Bureau of Labor Statistics Occupational Employment and Wage Statistics (OEWS) survey, May 2026 release. BLS reported a 90th percentile salary of $177,450 for civil engineers in the San Clemente metro area. A 2.63% compound annual growth rate (CAGR), calculated from 6-year national BLS wage trends, was applied to project current 2026 senior-level compensation. Individual earnings depend on certifications, specialization, practice type, and years of clinical experience.
Data Sources & Methodology
Salary data for San Clemente is estimated from official BLS state-level occupational wage data (2025), adjusted for regional cost-of-living differences using BEA RPP (Regional Price Parities).
2026 figures are projected from 2025 BLS data using a compound annual growth rate (CAGR) of 2.63%, derived from historical BLS wage trends for civil engineers (SOC 17-2051).
Compiled and verified by Jordan Chen, P.E., a licensed civil engineer with 10+ years of clinical experience. · View source data at BLS.gov