Civil Engineer Salary in Sterling, VA: $92,761 (2026)
Quick Answer:A full-time civil engineer in Sterling, VA earns a median $92,761/year (≈ $44.59/hour) in nominal terms for 2026 — projected from BLS OEWS 2025 (SOC 17-2051). Once you factor in Sterling's price level (3% above national, BEA RPP 103.2), that paycheck buys what $89,885 would nationally. Nominal pay sits 4.1% below the Virginia state average.
Based on BLS state-level estimates · View source
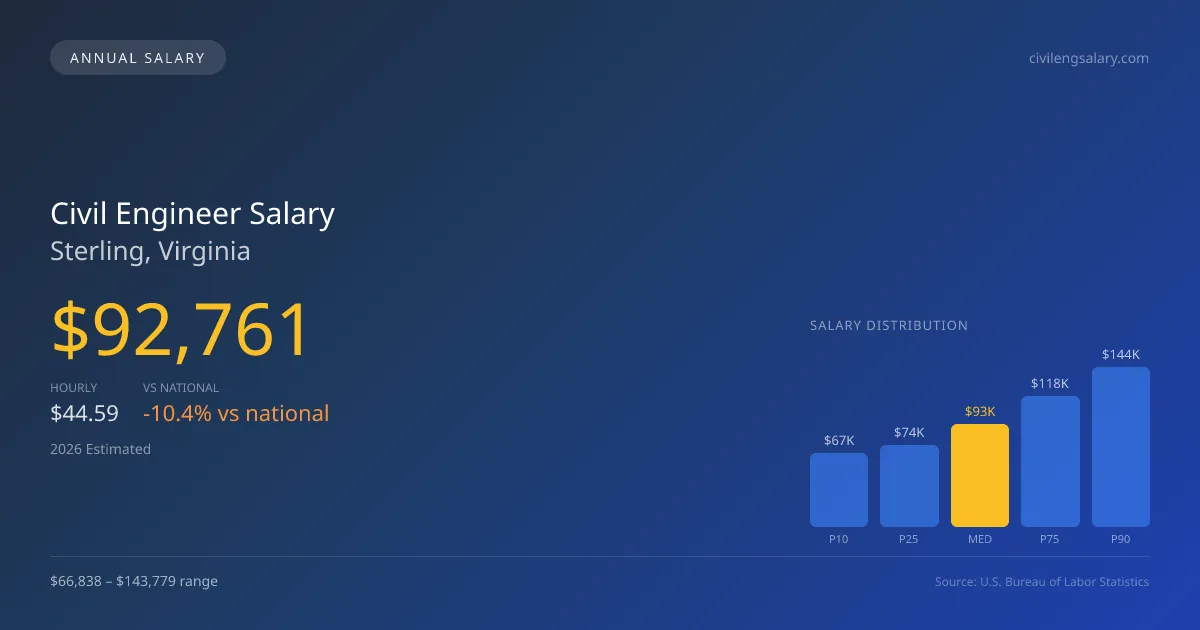
In 2026, a civil engineer in Sterling, Virginia, is projected to earn a median annual salary of $92,761, which reflects the competitive nature of the local market. This figure indicates a salary range spanning from $66,838 at the 10th percentile to a substantial $143,779 at the 90th percentile. These estimates, based on 2025 BLS data modified by regional price adjustments, provide valuable insight into Sterling's job market. The earnings reflect the divide among civil engineers employed in various sectors, including consulting firms like AECOM and Jacobs, government roles with entities like the Virginia Department of Transportation, and positions within construction companies that influence overall compensation in the area.
About the Sterling Market
Salary estimated from Virginia average ($108,000) adjusted for local cost of living.
Salary Breakdown
| Percentile | Annual | Hourly |
|---|---|---|
| Entry Level (P10) | $66,838 | $32.13 |
| Lower Range (P25) | $73,746 | $35.46 |
| Median (P50)(typical) | $92,761 | $44.59 |
| Upper Range (P75) | $118,167 | $56.82 |
| Top Earners (P90) | $143,779 | $69.12 |
Median Salary Position
10.37% below the national average
2026 Salary Percentile Distribution in Sterling
In Sterling, VA, the civil engineer salary spread from the 10th to 90th percentile is $76,941 (2026 est.). At $92,761, the local median is 10.37% below the national median of $103,492.
Salary Calculator
At 40 hours/week in Sterling: You'd be in the lower-middle range
How Sterling Civil Engineer Pay Compares
Sterling median: $92,761/year (2026)
| Compared To | Median Salary | Sterling Pays |
|---|---|---|
| Virginia Average | $96,727 | -4.10% less |
| National Average | $103,492 | -10.37% less |
Civil Engineers in Sterling, VA earn a median of $92,761 per year (2026 est.), which is 10.37% lower than the national median of $103,492 and 4.10% below the Virginia state average of $96,727.
Cost-of-Living Adjusted Salary
Sterling has a cost of living 3.20% above the national average.
Adjusted salary = nominal × (100 / CoL index). CoL index: 100 = national average.
Sterling, VA has a cost-of-living index of 103.2 (above the national average of 100). While the nominal salary of $92,761 is competitive, the higher cost of living reduces purchasing power to an effective $89,885 — a 3.1% reduction.
Compare Purchasing Power
Select a city to see how your salary compares after cost of living
Select a city above to compare purchasing power
2019 BLS Actual
$78,033
2025 BLS Actual
$90,384
2026 Current Est.
$92,761
2019–2027 Growth
+22.0%
Salary Trajectory for Civil Engineers in Sterling (2019–2027)
2019–2025: actual BLS OEWS data for this metro area. 2026+: CAGR 2.63% projection.
| Year | Annual Salary | Status |
|---|---|---|
| 2019 | $78,033 | Actual |
| 2020 | $79,386 | Actual |
| 2021 | $78,920 | Actual |
| 2022 | $80,614 | Actual |
| 2023 | $85,947 | Actual |
| 2024 | $106,940 | Actual |
| 2025 | $90,384 | Actual |
| 2026(current) | $92,761 | Estimated |
| 2027 | $95,201 | Projected |
Based on 7 years of BLS OEWS data for the Sterling metropolitan area, the median civil engineer salary grew 15.8% from $78,033 (2019) to $90,384 (2025). At a 2.63% compound annual growth rate, salaries are projected to reach $95,201 by 2027 — a total increase of $17,168 (22.00%) from 2019.
Note: Historical values (2019–2025) are actual BLS OEWS figures for the Sterling metropolitan area, sourced from annual Occupational Employment and Wage Statistics surveys. 2026–2026 figures are current estimates, and 2027 values are projections, calculated using a 2.63% CAGR derived from 7-year BLS historical data. Actual salaries may vary based on employer, experience, certifications, and local market conditions.
Salary by Experience Level
| Experience | Estimated Salary Range |
|---|---|
| 0-2 years (New Graduate) | $66,838 – $73,746 |
| 3-5 years (Mid Career) | $73,746 – $92,761 |
| 5+ years (Experienced) | $92,761 – $118,167 |
| 10+ years (Top Earner) | $118,167 – $143,779 |
CE, PE salary ranges estimated from BLS percentile data. Individual civil engineer compensation varies by employer, certifications, and specialization.
Civil Engineer Job Market in Sterling
The job market for civil engineers in Sterling appears limited but selective, with only seven professionals currently employed in the area. The local cost of living index stands at 103.2, slightly above the national average, indicating that while salaries are competitive, purchasing power may not be as robust as in other regions. Employers within Sterling range from large engineering consulting firms that generally offer higher salaries to local government and agency positions which may provide stability but often at a lower pay scale. Factors driving the variance in pay include the necessity of obtaining a PE license for more senior roles, specialty areas such as structural or geotechnical engineering, and the influence of firm tier on salary structures. Aspiring engineers should consider strategic options to boost their salaries by pursuing the PE license, seeking opportunities in high-end consulting firms, or focusing on in-demand specialties amidst a backdrop of increasing infrastructure investment fueled by the Bipartisan Infrastructure Law.
More salary data for Sterling, VA:
Frequently Asked Questions
How much do civil engineers make in Sterling, VA in 2026?
Is Sterling, VA a good place to work as a civil engineer?
Can civil engineers make $100K in Sterling?
What is the cost-of-living adjusted civil engineer salary in Sterling?
How much does a civil engineer make per hour in Sterling?
Related Pages
Compare Salaries
Career Resources
Nearby Cities in Virginia
Written by Jordan Chen, P.E.
Career Analyst
Jordan Chen has 10 years of experience in structural engineering. He works primarily in urban infrastructure projects.
Methodology & Data Source
Salary figures on this page are 2026 projections based on the Bureau of Labor Statistics Occupational Employment and Wage Statistics (OEWS) survey, May 2026 release. The BLS reported a median annual salary of $90,384 for civil engineersin the Sterling metropolitan area. A 2.63% compound annual growth rate (CAGR), calculated from 6-year national BLS wage trends, was applied to project current 2026 compensation. Percentile ranges (P10–P90) represent the full salary distribution across experience levels and practice settings in this market.
Data Sources & Methodology
Salary data for Sterling is estimated from official BLS state-level occupational wage data (2025), adjusted for regional cost-of-living differences using BEA RPP (Regional Price Parities).
2026 figures are projected from 2025 BLS data using a compound annual growth rate (CAGR) of 2.63%, derived from historical BLS wage trends for civil engineers (SOC 17-2051).
Compiled and verified by Jordan Chen, P.E., a licensed civil engineer with 10+ years of clinical experience. · View source data at BLS.gov